All About the Pod Podcast
The University of Georgia Peanut Team presents All About the Pod, a reoccurring podcast for peanut producers, industry partners, and anyone interested in learning about science-backed peanut production.
The goal of this podcast is to educate others about up-to-date problems our researchers see in the field. All About the Pod will feature extension specialists, research faculty, graduate students, extension agents, industry allies, and growers.
The UGA Peanut Team had a productive week in Brazil visiting multiple sectors of the peanut industry. The trip was held from 13 to 17 March and visit included two universities, UNOESTE in Presidente Prudente and UNESP in Jaboticabal, Beatrice Peanuts, Coplana, Colombo machinery industry, Agronomy Research Institute (IAC), and peanut growers.
Team members attending were Drs. Babu Srinivasan, Bob Kemerait, Cris Pilon, Glen Harris, Mark Abney, Scott Monfort, Scott Tubbs, and Tim Brenneman. The tour was planned by Dr. Cris Pilon along with Dr. Fabio Echer from UNOESTE and Dr. Rouverson Silva from UNESP. Drs. Echer and Silva have active collaborations with multiple UGA faculty members.
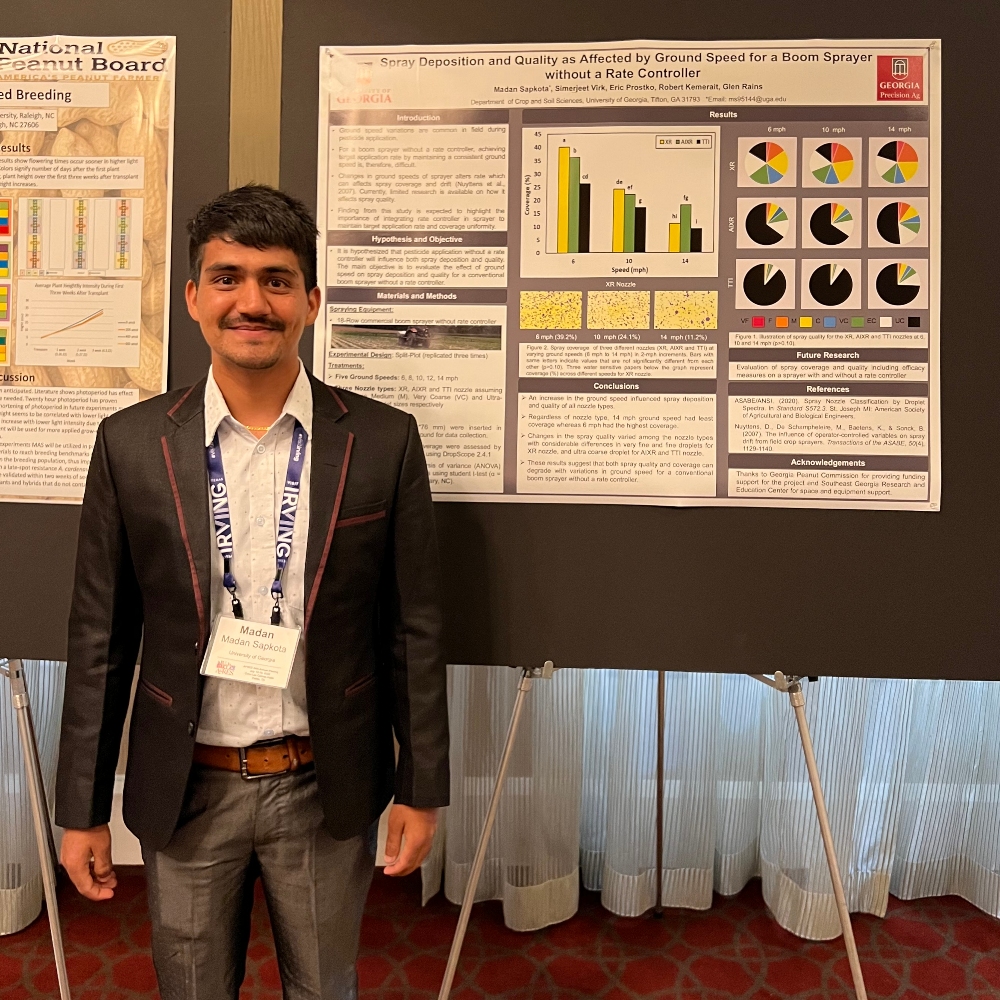
Sapkota Awarded 2nd Place in Poster Competition
Madan Sapkota, M.S. student advised by Dr. Simer Virk, won second place in the M.S. Poster Competition at the American Peanut and Research Society's (APRES) annual meeting in Dallas, Texas.
Sapkota presented his work on selection of optimal spray parameters and utilization of precision spray technologies for pesticide applications in peanut.
Latest - UGA Peanut Entomology Blog